Research components
The design system was built so academic researchers can assemble Android
validation apps with little effort and a professional look. This page closes the
showcase with the scientific / data-science layer: metric cards, data charts,
the detection overlay and the results table — the direct bridge to the
ort-vision-sdk.
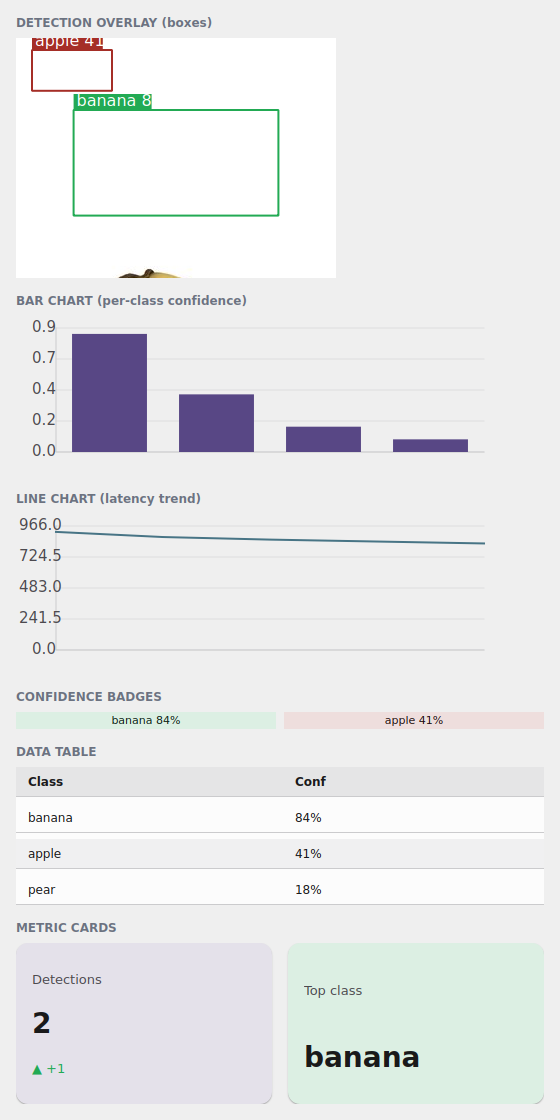
The examples/h6gallery example in the Qt simulator: DetectionOverlay,
BarChart, LineChart, ConfidenceBadge, DataTable and MetricCard — a
vision-result dashboard, all theme-tinted.
Where the names live
Everything on this page imports from tempestroid: the components
(MetricCard, StatCard, ConfidenceBadge, LineChart, BarChart,
DetectionOverlay, ResultView, DataTable, Calendar, Clock), the data
objects (ChartSeries, DetectionBox) and the confidence_scheme helper.
MetricCard and StatCard — the KPI
MetricCard is the metric card of a research screen: a large number, a label and
an optional delta (the change, green up / red down via delta_up). StatCard
is the same card in a denser variant.
from tempestroid import HStack, MetricCard, Widget


def metricas(theme) -> Widget:  # theme: Theme
    return HStack(
        gap="md",
        theme=theme,
        children=[
            MetricCard(label="Detecções", value="2", delta="+1", delta_up=True,
                       color_scheme="primary", theme=theme, key="m1"),
            MetricCard(label="Classe top", value="banana",
                       color_scheme="success", theme=theme, key="m2"),
        ],
    )
ConfidenceBadge — the confidence pill
ConfidenceBadge shows a confidence score as a colored pill. You pass
confidence (a float in [0,1]) and a label; the component picks the
color_scheme by threshold via confidence_scheme — high → success, mid →
warning, low → error — always with WCAG-AA contrast.
from tempestroid import ConfidenceBadge, HStack, Widget


def confiancas(theme) -> Widget:  # theme: Theme
    return HStack(
        gap="sm",
        theme=theme,
        children=[
            ConfidenceBadge(confidence=0.84, label="banana", theme=theme, key="c1"),
            ConfidenceBadge(confidence=0.41, label="apple", theme=theme, key="c2"),
        ],
    )
The threshold is configurable
confidence_scheme(conf, *, high=0.8, mid=0.5) is the shared picker: it's the
same function DetectionOverlay uses to tint its boxes. Call it directly if
you want the color_scheme ("success"/"warning"/"error") of a score in
another component.
LineChart and BarChart — data becomes drawing
The charts turn data into Canvas commands (the same JSON list as the
conformance suite, identical on both renderers). BarChart takes values +
labels; LineChart takes a list of ChartSeries (each with points, label
and color_scheme):
from tempestroid import BarChart, Widget


def barras(theme) -> Widget:  # theme: Theme
    return BarChart(
        values=[0.84, 0.41, 0.18, 0.09],
        labels=["banana", "apple", "pear", "lemon"],
        width=480.0,
        height=160.0,
        color_scheme="primary",
        theme=theme,
    )
from tempestroid import ChartSeries, LineChart, Widget


def linha(theme) -> Widget:  # theme: Theme
    return LineChart(
        series=[
            ChartSeries(
                points=[920.0, 880.0, 860.0, 845.0, 830.0],
                label="latência ms",
                color_scheme="secondary",
            ),
        ],
        width=480.0,
        height=160.0,
        theme=theme,
    )
DetectionOverlay — the ort-vision-sdk bridge
DetectionOverlay draws an image with bounding boxes on top — exactly the
shape a vision app produces. You pass image_src (path or URL) and a list of
DetectionBox, and the component tints each box by confidence (via
confidence_scheme).
from tempestroid import DetectionBox, DetectionOverlay, Widget


def deteccoes(theme) -> Widget:  # theme: Theme
    return DetectionOverlay(
        image_src="/caminho/para/banana.jpg",
        boxes=[
            DetectionBox(x1=0.18, y1=0.30, x2=0.82, y2=0.74, name="banana", conf=0.84),
            DetectionBox(x1=0.05, y1=0.05, x2=0.30, y2=0.22, name="apple", conf=0.41),
        ],
        width=320.0,
        height=240.0,
        theme=theme,
    )
DetectionBox is normalized — and the engine doesn't know the SDK
A DetectionBox's x1/y1/x2/y2 fields are normalized xyxy in
[0,1] (fractions of the image width/height), not pixels — the
DetectionOverlay scales to whatever size you give. The engine has no
ort-vision-sdk dependency: the adapter that converts the result of
Detector.predict(...) into DetectionBoxes lives in your app. You read
the SDK boxes (in pixels), divide by width/height and assemble the list — the
design system only draws.
DataTable — the results table
DataTable is the styled table with sorting and pagination: columns +
rows (a list of lists of cells). It follows the theme and zebra-stripes the
rows.
from tempestroid import DataTable, Widget


def tabela(theme) -> Widget:  # theme: Theme
    return DataTable(
        columns=["Classe", "Conf"],
        rows=[["banana", "84%"], ["apple", "41%"], ["pear", "18%"]],
        theme=theme,
    )
More research components
The same layer brings ResultView (the image→result wrapper), and the time
utilities Calendar/Clock. All follow the theme. See the full catalog in
the widgets overview and the
public API.
Full example: the vision dashboard
examples/h6gallery/app.py draws a complete vision-result dashboard —
DetectionOverlay with boxes over a real image, two MetricCards, the
ConfidenceBadge pair, the per-class BarChart, the latency LineChart and the
detections DataTable:
The full source is in
examples/h6gallery/app.py.
On the device, the same view/make_state loads in the Compose host; because
the whole layer is composite components, the charts lower to Canvas and the
metrics to primitives on both renderers.
Recap
MetricCard/StatCardare the KPI (number +delta/delta_up+color_scheme).ConfidenceBadgeis the confidence pill; the threshold comes fromconfidence_scheme(conf, *, high=0.8, mid=0.5), AA-safe.BarChart/LineChartturn data (values/labelsorChartSeries) intoCanvascommands identical on both renderers.DetectionOverlaydraws image +DetectionBoxes in normalized xyxy[0,1], tinted by confidence — theort-vision-sdkbridge, whose adapter is app-side (the engine doesn't depend on the SDK).DataTableis the table with sorting/pagination;ResultView/Calendar/Clockcomplete the layer.
Next: the storybook (gallery) — the whole system in one app, with the light/dark and LTR/RTL toggles.